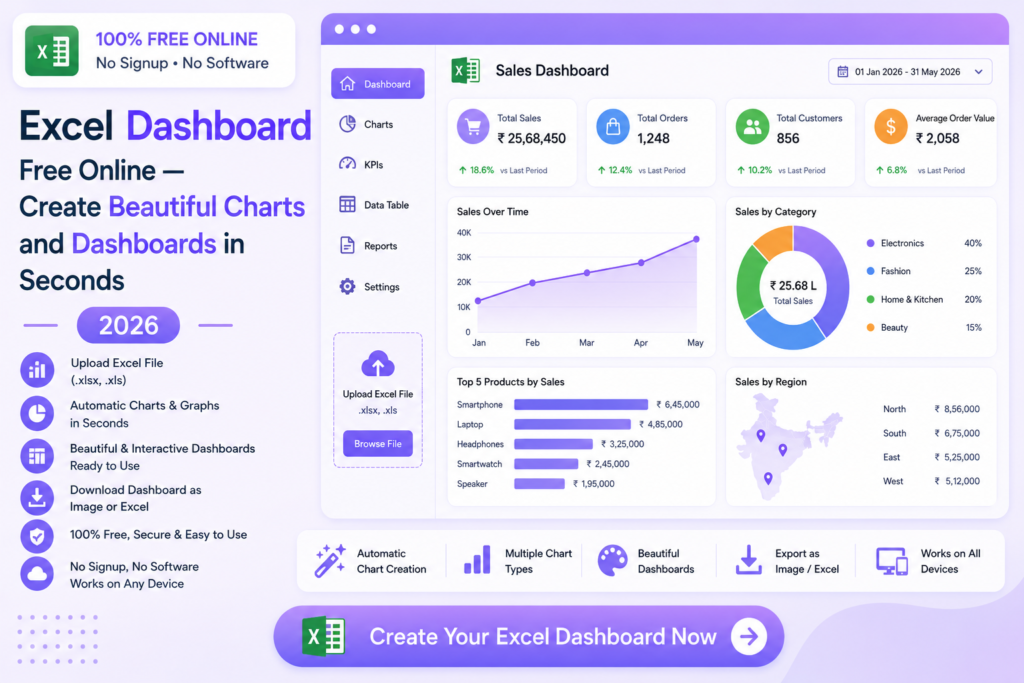
Excel Dashboard Free Online — Create Beautiful Charts and Dashboards in Seconds 2026
Upload any Excel file and get interactive charts and dashboards generated automatically — no software, no signup, no payment required.
📊 Create Dashboard Free — Try Now
📋 In This Guide
What is an Excel Dashboard Generator?
An Excel dashboard generator is an online tool that automatically creates visual charts and interactive dashboards from your Excel data. Instead of spending hours building charts manually in Excel, you upload your file and the tool generates professional visualizations in seconds.
Dashboards transform raw spreadsheet data into clear, visual summaries that are easy to understand and present. Whether you need a sales performance overview, expense breakdown or trend analysis — a dashboard makes the insights immediately visible.
✅ MySmartWork’s Excel dashboard free online tool automatically generates beautiful interactive charts from your Excel data — completely free, no signup, export as image or PDF.
Why I built this: I manage IT and business asset tracking at work, and kept spending time manually building charts in Excel for spend reports. I built this tool to skip that step entirely — upload the file, get the dashboard.
A Real Example
To test this, I uploaded an actual IT asset purchase log — 124 records across 7 columns (Product, Model, Qty, Sr. No., Amount, Purchase Date, Company). The tool auto-detected the numeric columns and generated a full dashboard in seconds: total spend (₹11,52,340), a monthly spend trend line, and a donut chart breaking down spend by vendor. It correctly identified that 78% of purchase volume was Dell laptops versus 5% Apple, and flagged January 2022 as the highest-spend month — all without me selecting any columns manually.
Limitations to know: With repetitive data (like the same laptop model ordered many times), the auto-generated charts can look cluttered since every row gets its own bar by default — use the “Build Custom Chart” section to group by a specific column instead. Very large files (10,000+ rows) may take a few extra seconds since everything processes in your browser, not on a server. Date columns need a consistent format or the trend chart may not read them correctly.
How to Create an Excel Dashboard Free — Step by Step
Upload your Excel file
Open the Excel Dashboard tool and upload your .xlsx or .csv file. The tool reads your data columns and rows automatically.
Select columns and chart type
Choose which columns to visualize and select the chart type — bar, line, pie, scatter or more. The tool generates the chart instantly.
Export your dashboard
Download your charts as images or PDF — ready to share in presentations, reports or emails.
⚠️ Tip: For best results, ensure your Excel file has clear column headers in the first row. The tool uses these headers to label your chart axes automatically.
Chart Types You Can Create
Bar Chart
Compare values across categories clearly
Line Chart
Show trends and changes over time
Pie Chart
Show proportions and percentages
Area Chart
Visualize cumulative data over time
Scatter Plot
Show relationships between two variables
Data Table
Formatted summary table from raw data
Free vs Paid Tools
| Feature | MySmartWork (Free) | Paid Tools |
|---|---|---|
| Cost | ✅ Completely Free | ❌ Monthly subscription |
| Signup Required | ✅ No | ❌ Yes |
| Chart Types | ✅ Bar, Line, Pie, Scatter | ✅ More advanced types |
| Export Options | ✅ Image, PDF | ✅ More formats |
| Real-time Data | ⚠️ Upload based | ✅ Live data connections |
| File Privacy | ✅ Processed in browser | ⚠️ Uploaded to server |
Common Use Cases
💼 Sales Reports
Transform monthly sales data into visual bar and line charts that clearly show performance trends, top products and regional comparisons — perfect for management presentations.
💰 Expense Tracking
Upload expense data and create pie charts showing spending by category — instantly see where your budget is going without manual analysis.
📦 Inventory Analysis
Visualize stock levels, reorder points and product movement with clear charts that make inventory decisions faster and more accurate.
🎓 Academic and Research Data
Students and researchers can quickly create professional charts from survey data, experimental results and statistical tables for reports and presentations.
Frequently Asked Questions
Is the Excel dashboard tool really free?
Yes, MySmartWork’s Excel dashboard free online tool is completely free — no hidden charges, no subscription, no signup required.
What file formats are supported?
The tool supports Excel files (.xlsx, .xls) and CSV files (.csv).
Can I export the charts?
Yes, charts can be downloaded as image files or PDF — ready to use in presentations and reports.
Is my data safe?
Yes. Your file is processed within your browser and is never uploaded to any external server. Your data stays completely private.
Does it work on mobile?
Yes, the tool is fully mobile-friendly and works in any browser on Android and iPhone devices.
📊 Create Your Excel Dashboard Free — Right Now
No signup. No software. No payment. Upload your Excel file and get beautiful charts instantly.
Open Excel Dashboard Tool →